


Several criteria for making the diagnosis of bladder outflow obstruction and detrusor under activity (DU) in women have been described, but there is a lack of consensus in key definitions. Voiding function becomes much more complex when the effects of abdominal straining are taken into account because it raises the urinary flow rate not due to better detrusor contraction strength but by energy delivered by the abdominal muscles. DU encompasses low-pressure, poorly sustained detrusor contraction, and low urinary flow. There are different ways to assess detrusor contraction strength.
Isovolumetric detrusor pressure is the detrusor pressure obtained when the urinary flow rate is brought to zero in a stop test during voiding (in women by pulling a balloon catheter against the bladder neck). This method is difficult to perform and is uncomfortable.
The “ICS detrusor contraction index” (ICS-DCI = pdetQmax+5Qmax), previously known as “bladder contractility index”, is a projected isovolumetric pressure, i.e., an estimate of the isovolumetric detrusor pressure, derived from the ‘‘contractility’’ groups described by Prof. Werner Schäfer in men, which are simplified bladder output relation (BOR) curves using straight lines. Although this parameter is also recommended for analyzing female voiding, it tends to overestimate isovolumetric pressures in women. A more reliable estimation (described in elderly women with urgency urinary incontinence) has been called projected isovolumetric pressure 1 (PIP1), based on the formula: PIP1 = pdetQmax+Qmax. Contractions with PIP1 smaller than 30 cm H2O might be considered weak.
Cut-off points, unlike PIP1, don’t follow the concept of the BOR curve; this is that within the same detrusor contraction strength, there may be different detrusor pressures and flows depending on the bladder outlet resistance. The Watts factor is based on the analysis of the relationship between detrusor pressure and muscle shortening velocity. It is complex to calculate, and there is no consensus on threshold values.
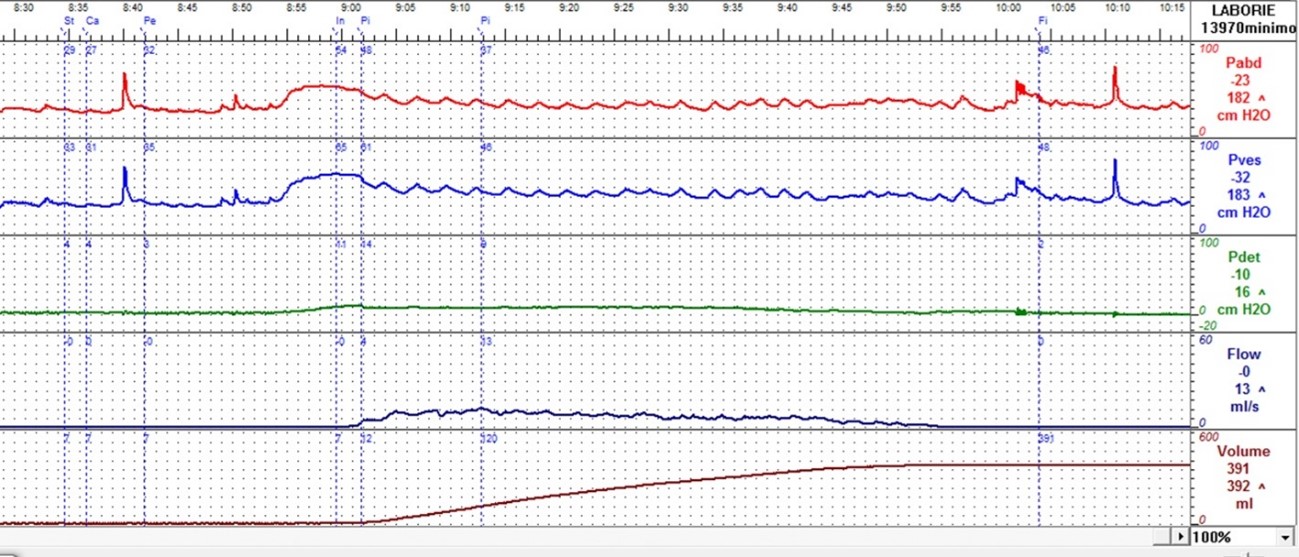
Figure 1. Detrusor underactivity. Qmax=13 mL/s, pdetQmax=9 cmH20, voided volume=383 mL, PVR=5 mL. PIP1=22 cmH20.
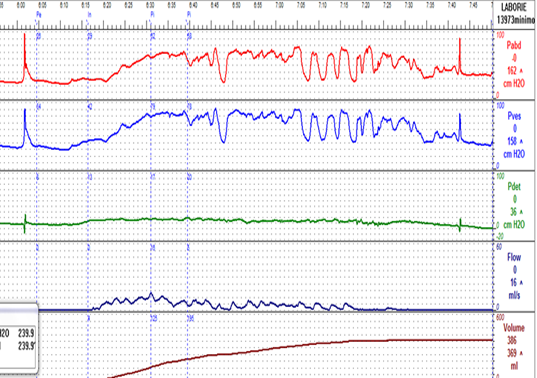
Figure 2. Detrusor underactivity with relatively preserved maximum flow rate due to abdominal straining, leading to falsely normal PIP1. Qmax=16 mL/s, pdetQmax=18 cmH20, voided volume=363 mL, PVR=15 mL. PIP1=34 cmH20. Increase of abdominal pressure at Qmax from baseline: 41 cmH20.